In this article, we will delve into the process of getting a Debugger working for cucumber inside visual Studio using Ruby in Steel.
If you have never seen Ruby in Steel. I highly recommend it, so go check it out at http://www.sapphiresteel.com/.
If you have never used cucumber from within visual studio, check out Brendan Erwin’s article on “Quick and Easy Cucumber Integration in Visual Studio.
http://brendanjerwin.github.com/2009/04/07/quick-and-easy-cucumber-integration-in-visual-studio.html
Done with all that? Good let’s get started!
Step 1.
Go to the link above and download/install Ruby in Steel (RiS), they offer a 60-day trial license so you have plenty of time to play around with it.
Step 2.
Once installed, open up visual studio, to any project you would like to add cucumber integration to. Right-Click on the solution, and add a new ruby project.
Step 3
Create your cucumber files & folder structure.
Step 4
Now comes the interesting part. In order to get cucumber to run within RiS, you’ll need to define an entry point for cucumber so that the RiS debugger can load the debugging symbols.
There are many ways to do this, when I first attempted to tackle this problem, I took the cucumber ruby file and added it to my solution…but I couldn’t figure out how to make it only run the scenarios I wanted.
Along came the C# helper program!
1: static void Main(string[] args)
2: {
3: var stream = GetEmbeddedFile("CucumberDebugger", "cucumber.rb");
4:
5: FileStream fs = new FileStream(@"C:\ruby\bin\CucumberDebugger.rb",FileMode.Create,FileAccess.Write);
6:
7: ReadWriteStream(stream, fs);
8:
9: string workingDirectory = args[0];
10: string itemPath = args[1];
11:
12: string lineNumber = "";
13:
14: if (args.Length == 3)
15: lineNumber = args[2];
16:
17: System.IO.StreamWriter file = new System.IO.StreamWriter(@"C:\ruby\bin\debuginfo.dbg");
18: file.WriteLine(workingDirectory.Replace('\\', '/').Remove(workingDirectory.Length-1));
19: file.WriteLine(itemPath.Replace('\\', '/'));
20:
21: if (args.Length == 3)
22: file.WriteLine(lineNumber);
23:
24: file.Close();
25:
26: }
Basically, what this program does is take 3 command line arguments: Project Directory, Item Path, and optionally Current Line and saves them to a file called “debuginfo.dbg”. It also takes an embedded resource, cucumber.rb and and writes it to the ruby directory for use as well. This ruby fill will be the entry point for our debugger. It takes all the parameters from the “debuginfo.dbg” file and kicks off cucumber with those params.
1: require 'rubygems'
2:
3: lineNumber = nil
4: file = File.new("debuginfo.dbg", "r")
5:
6: workingDir = file.gets.chomp();
7: featureFile = file.gets.chomp();
8:
9: begin
10: lineNumber = file.gets.chomp();
11: rescue
12: end
13:
14: version = ">= 0"
15:
16: if ARGV.first =~ /^_(.*)_$/ and Gem::Version.correct? $1 then
17: version = $1
18: ARGV.shift
19: end
20:
21: ARGV[0] = '--guess';
22: ARGV[1] = '-r';
23: ARGV[2] = "#{workingDir}/features/"
24:
25: if (lineNumber == nil)
26: ARGV[3] = "#{featureFile}"
27: else
28: ARGV[3] = "#{featureFile}:#{lineNumber}"
29: end
30:
31: gem 'cucumber', version
32: load 'cucumber'
You can download the full C# solution here: CucumberDebugger.zip
Step 5
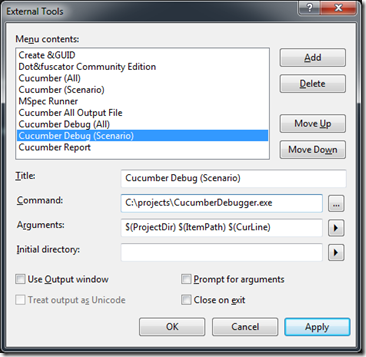
Now we need to create an external tool that will call our CucumberDebugger.exe with the parameters we need.
Create a new tool called Cucumber Debug (Scenario) with the settings below:
Arguments (for ease of copy/paste): $(ProjectDir) $(ItemPath) $(CurLine)
Step 6
Now go to your *.feature file, choose the scenario to run (place your cursor there), and run your external tool.
This will create 2 files at C:\ruby\bin. “cucumberDebugger.rb” and “debuginfo.dbg'”
Last step
All we need to do now, is tell the debugger to look for our entry point file, and kick it off.
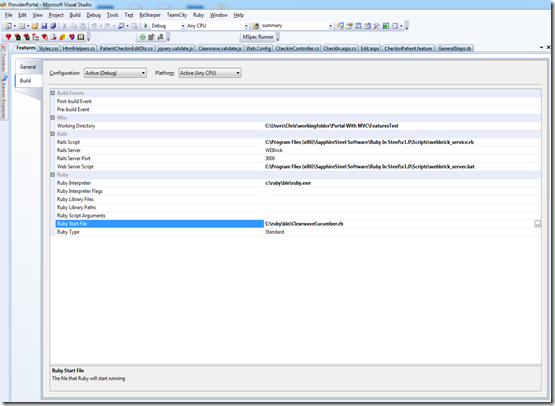
Right-Click on your ruby project and go to “Properties”, then the build tab.
Set your ruby start file to: C:\ruby\bin\CucumberDebugger.rb, save and close.
Go back to your feature file and click Run!
You can now step through your ruby code just like any other .net file!
Enjoy!
Please let me know if you have any questions.


